
Tracking patterns in the relative use of different communications media in new businesses
In a previous blog, we used Google analytics data for web searches to examine the question as to how the choice of communication media for B2B commerce may have changed over time in the UK. The present blog addresses the distribution of communication media choices made by new businesses in the UK. To examine the relative usage rates for the different forms of communication media employed by new businesses, we created a structured sample from our database of newly active trading entities (NATE).
The sample consisted of 4,000 businesses who have appeared in our database since August 2015 and which, at the time of this study had a website which we could examine for evidence fate communication channels they support.
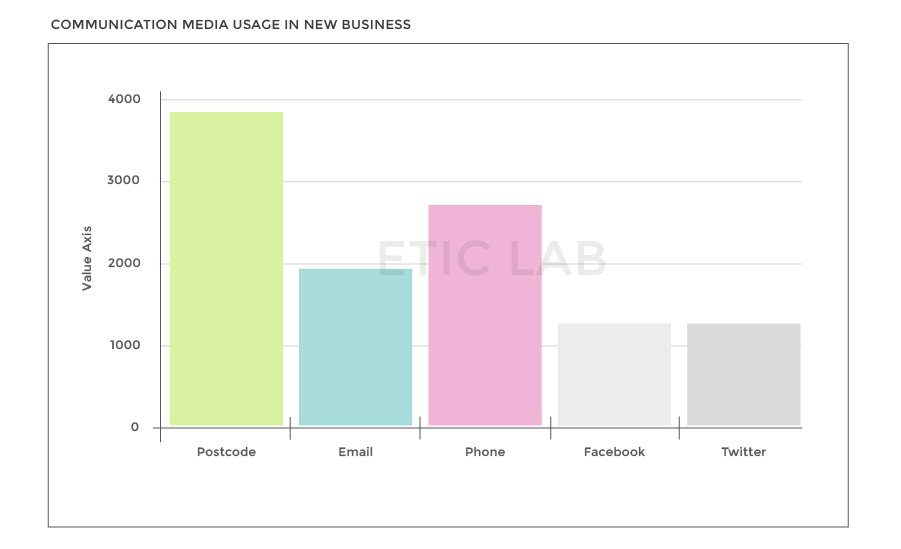
As can be seen from the graph above, the most frequent and hence perhaps the most critical channel is a physical address, followed by a phone number in almost 50% of cases. Interestingly, less frequent, in that only roughly 30% of companies use them, Twitter and Facebook contacts are offered in nearly the same proportions as one another.
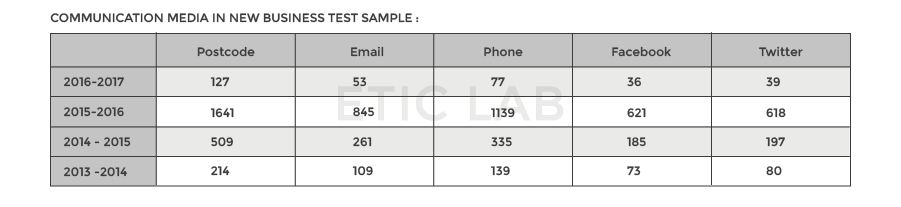
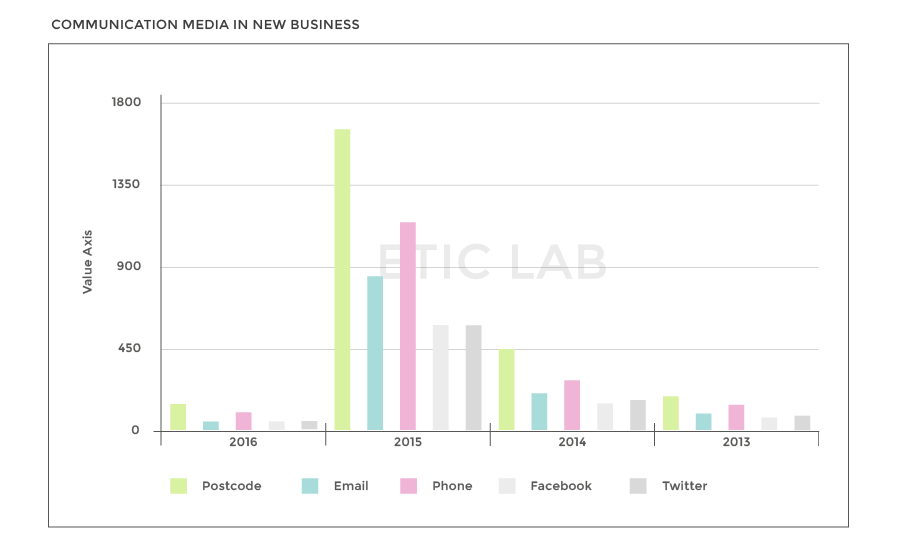
Because most, but not all of these new companies also had a companies house registration we could stratify the sample by their date of incorporation. This data is presented below and demonstrates that notwithstanding the year of incorporation, the proportion of business communication channels included in their websites remained static. That is to say over the period during which these businesses started up; it is clear that the ratio of each channel built into their websites remained precisely the same. If we examine the sample incorporated in late 2013, they exhibit the same channels in the same proportions as those incorporated in early 2016.
It would seem from these data that when choosing channels for incoming communication from customers an address, telephone number and to a lesser degree E-Mail are always included in fixed proportions. This means that in 2016 a new business creating its website and opening up for business will rely first and foremost on a postal address – followed by telephone more than 60% of the time and email 50% of the time. Similarly, Twitter and Facebook are included in precisely equal numbers but with about 25% the frequency of an address.
This suggests that concerning the operation of their business websites, companies place far more importance on inwards communication (Post, E-Mail, Telephone) than on broadcast communication (Twitter and Facebook). It remains to be seen if this pattern applied to companies that have been trading for an extended period or indeed if the proportions vary between industries. Although it would seem highly likely with the percentages being as consistent as they are regardless of incorporation year, these data reflect a clear division between the frequency with which the two forms of communication are presented on contemporary business websites.
The next phase of our research will be to take a meaningful sample from our database of 1,000,000 British business websites and determine if in this pattern the deployment of the different communication channels holds with more established businesses.