
In this demo, we demonstrate VOILA’s ability to query and compare the average business rates charged to different kinds of business in Wolverhampton, Milton Keynes and Walsall
After more than a year of work, we have completed a working version prototype of the Business Rates database project (Voila).
This entirely new architecture allows us to query our dataset to look at Business entities trading in England and Wales and cross-reference them in many new and powerful ways. Our purpose is to locate in one place all available forms of data that describe trading businesses in the UK. Our new design architecture combined with a variety of data refining technologies has created a unique tool for exploring, understanding and manipulating data about businesses. Because our system was built from the ground up to be served by a modern query engine we can ask questions concerning businesses trading in England and Wales that cannot be answered from any other single source, indeed in many cases; they cannot be answered at all from current sources.
As an example, there are some 1.43 million properties with a rateable value of approximately £43 Billion on the Central and Local Rating Lists according to the ONS (ONS, 2014). Our database allows us to raise queries concerning the web presence, type of activity, legal status, location, value, type and size of more than 1.7 million businesses – including the properties they occupy – in any possible combination. Already the database contains more commercial properties than the most recent (2014) government data suggest exist. Much more exciting is the fact that not only can our data be accessed in many different ways, but it is also inherently richer than any other database of its kind. It would be giving too much away to discuss this at any length here, but sufficient to say that by using modern data acquisition, cleansing and integrating technologies we have created something very powerful indeed.
The exciting point of all this work is we can now begin to mine this unique dataset in completely novel ways – creating or discovering perhaps, new knowledge about the massive commercial property portfolio in the UK. It is now possible for the first time, to compare one town with another or indeed one part of a town with another part of the same town to examine the cost of business rates. You can ask for the total number of factories or shops in a given town or compare towns. Examine the number of facilities such as GP surgeries or Pubs in different locations. One of our first projects was to take a particular business district in one city and compare the size and rateable value of the storage depots in the two towns.
This led us to ask what the difference between the cost of business rates in different towns is? We know that the Valuation Office Agency methods for determining the rateable value of property take account of local property prices so it must vary by locality. When we researched those differences, we discovered that official data does not go beyond regional summaries of aggregate business rates costs. In fact, we could not find any reliable guide to business rates costs on commercial property sites, government including local government sites or indeed in official statistics. So we asked out the database to compare two sites one we know and another we are considering. The data tables include a third town – Walsall because we are nosey.
Our query was straightforward, what is the average cost per square metre of the principal kinds of commercial property in Wolverhampton and Milton Keynes. We could have looked at the median property or just looked at properties of a particular size, but we thought that to start with we would look at the big picture as it were.
The results are interesting in some ways. It is no surprise that in all property categories Milton Keynes is more expensive in term of business rates than the city of Wolverhampton. However, what is remarkable is the extent of that difference and the fact that it varies so much between property types.
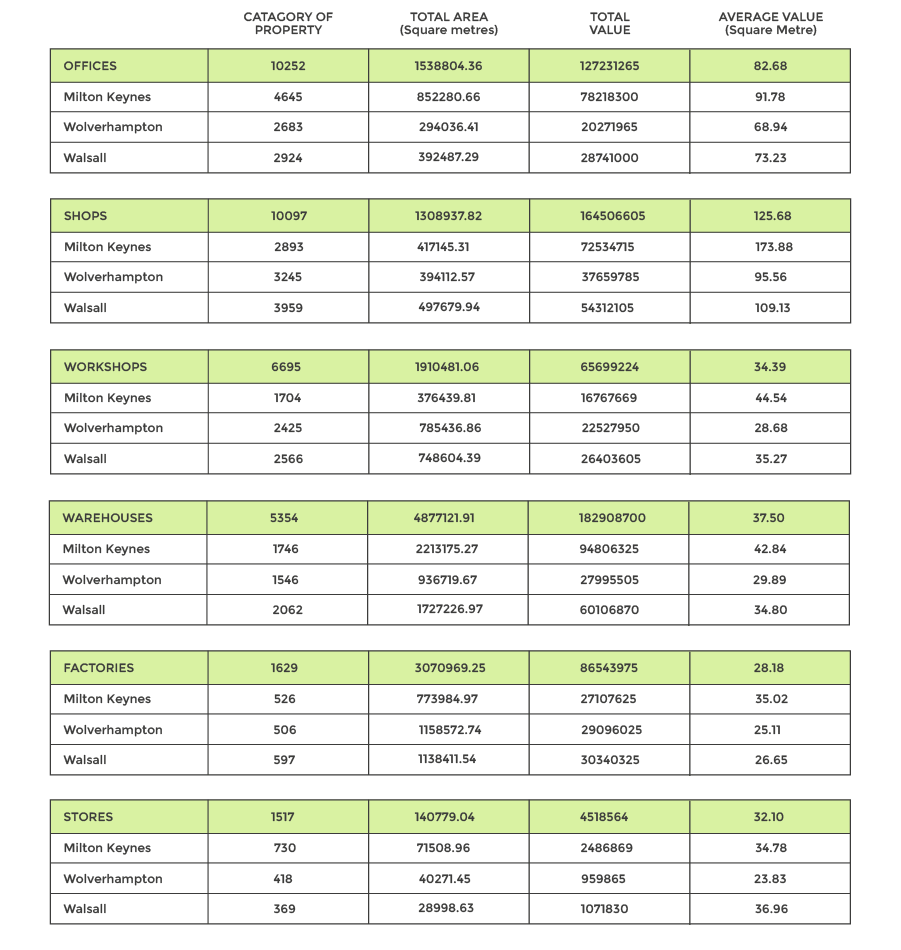
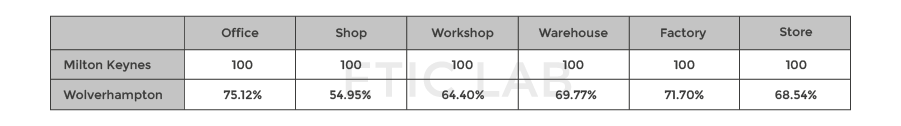
Perhaps the most unexpected result, as a layperson is the finding that not only does Milton Keynes have more factories than Wolverhampton but that they are so much more expensive regarding business rates. But then the data also shows that they are a different size (often smaller) than their counterparts in Wolverhampton. Taking the simple average size of Factory in Milton Keynes to be around 1500 square metres that would cost £51,535 in Milton Keynes and £37,000 in Wolverhampton. The table below sets out a comparison of the rateable value for each type of property expressed as a percentage of the rate in Milton Keynes.
Voila also revealed that each city has a distinct pattern of rateable value differences within the locality, where the average cost of the same category of property can vary considerably. Again, an expected result but given that Rates can contribute around 45% of property costs in a year, data that is very hard – if not impossible to readily access.
One major activity that is covered by our data is the nature and success rate of Business Rates appeals, the effort by businesses to mitigate their Business Rates by appealing the valuation of their property by the Valuation Agency (VOA). In our next blog, we will be looking at some data showing the school of this activity and the different ways in which our database can help users explore the issues surrounding Business Rates mitigation.