
We reflect on the challenge of collecting, organising and curating the data that powers VOILA – our business rates analysis tool. Most of the data that makes up the final collection was taken from the VOA where you can currently purchase a complete or partial copy of the Ratings List by getting in contact with them. (http://www.2010.voa.gov.uk/rli/en/basic/contactUs)
The product spec for Voila described functionalities currently unsupported by any public sector app, using databases thus-far unavailable for public use.
Any database we constructed would have to support searches on Non-Domestic Rateable Properties by fields representing physical properties, geographical location, valuation histories and appeals (successful or unsuccessful) and other publicly open information describing the features of the property’s local environment (i.e. road traffic, planning permissions), amongst other things.
To warehouse this data, we planned a non-relational database, built around MongoDB technology, where each object would represent a single Non-Domestic Rateable Property with branches, which could be extended as other data, such as appeal histories, are added. A postcode and geocoded address could be used to link to other data sources such as live API access to public transport timetables for more complex queries.
The diagram below demonstrates the MongoDB data structure.
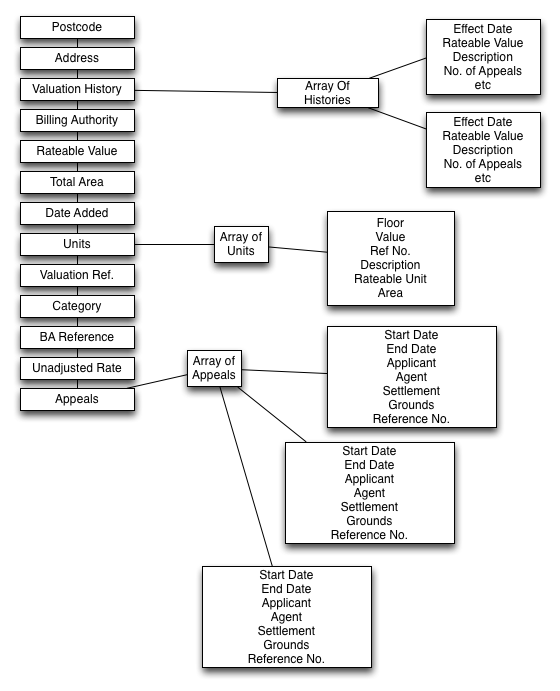
Etic acquired these data using software designed explicitly for curating the warehouse. As such it can renew and replace objects as the sources of the data report changes. A complete sweep of the data warehouse by the software takes about a month, so for Voila, the veracity of the data should always be guaranteed within a one-month timescale.
After this collection, using a program written in Python, Etic structured the data, pulling in the static elements from a variety of sources and inserted collections defined by regions of the UK into an instance of MongoDB. Below is an example of a simple object created as a dictionary, including a nested appeal history, being inserted into the database.
NESTED APPEAL STRUCTURE CODE:
<script src=”https://gist.github.com/alexhogak/51dfd5c8bf198deda54649cfbcf4bcb2“></script>
DICTIONARY INSERT CODE:
<script src=”https://gist.github.com/alexhogak/34e980cffcb01f91e2ba4e5328038c8d“></script>
To sit under the app’s front end, we produced, from this warehouse, a series of SQL tables, supporting the complex queries desired. To do this, we unwound some of the trees in the MongoDB warehouse to produce stand-alone, query-able tables containing, for example, appeals data or data on physical properties.
MONGO UNWIND EXAMPLE:
<script src=”https://gist.github.com/alexhogak/b2f4f0e5d19ca3c6b81a4c39378acc7d“></script>
Above is an example of an unwind instruction issued in mongo to create a database of individual appeals, including data about the individual Rateable Property against which it was made. As an indication of the extent of the database, at the time this blog was written, NDRPs in the Northamptonshire postcode totalled some 25848, against which 17834 historic appeals were recorded.
Curating of the data occurs in several processes. First, as described above, the software used to initially collect the data also rechecks and updates it on a monthly cycle. This cycle triggers a flag with a timestamp if any changes have occurred, the value of the flag determining the kind of change (new appeal, change of function etc.) which can present data about the rate of recorded change over use-types, geographies etc.
Second, at a certain point within the monthly cycles, the static relational tables that lie under the app’s front end are updated from the warehouse. These tables are automatically generated and sent to out web-developer, with a report on the metadata of the changes in them.
Finally, the app itself records usage data against properties returned by queries. This data is stored in a separate table but linked to the properties, so it is possible to support data mining concerning the features of a property and the frequency with which it is the result of a search.
Hopefully, this blog has elaborated upon the way Voila’s data is maintained. Part Two of this series intends to demonstrate how the data in providing Voila’s functionality.