Every quarter our NATE survey identifies all of the newly trading entities in the Welsh and English Regions. New data showing the location of new business start-ups in the English regions shows that far from catching up, the Northern Powerhouse is perhaps not even capable of slowing the juggernaut of economic concentration in London.
To shed light on the debate concerning the scale and significance of the ‘Northern Powerhouse’ concept we set out to examine in some detail where new businesses are being set up. Reasoning that the geographical pattern of business growth, especially new businesses would demonstrate the nature of the effect if it exists at all.
Every quarter our NATE survey identifies all of the newly trading entities in the Welsh and English Regions. This survey is not limited to new Companies House registrations over that period but is a rather more comprehensive and multi-faceted survey of business ‘births’ conducted by us every quarter. We took all 118,000 new businesses identified in the last quarter of 2015 and used them in this analysis. Every business we identified was located within its ward, and every ward was then allocated to its appropriate region. These data were then examined in some ways to explore the pattern of new businesses being established across the country.
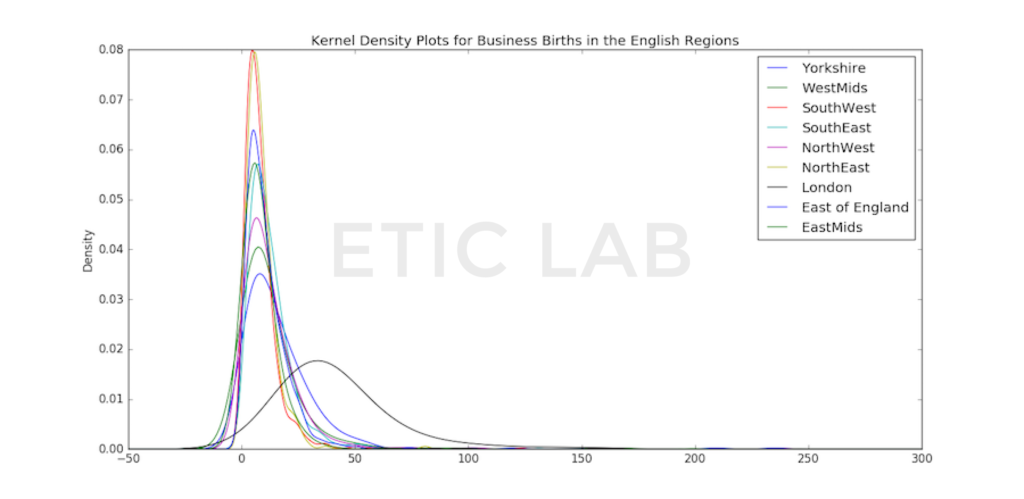
We decided to plot a Kernel-Density Estimate Function using matplotlib in Python. To do this, we took all of the wards using their count of the new businesses over the sampling period. These data were then aggregated into the English Regions, producing nine series. This was then plotted to give us a Kernel Density Estimate distribution of new companies established in the English regions for comparison purposes. Our data shows the relationship between the absolute volume of new businesses in each ward as a function of their geographical distance from one another.
The graph shown below has two major features which reveal a good deal about the nature of new business formation and the influence and nature of a ‘London’ effect. First of all, we can see that there are two distinct categories of distribution in these data. The characteristic steep peak of all of the English regions except London reveals the importance of centres of high population density. No English region matches London for the number of different centres of population density and as we would predict, on the whole, the wards with most new businesses – almost all of which are geographically close to the centre of a city. To the extent that there are multiple cities in a region, the plot is both wider and less steep. So the North East region with a dearth of cities and a relatively low population density is very much steeper than the curve for the North West.
The second distribution in this representation is that of London. Essentially this population centre has a distribution that is very different from the rest of the English regions, even though they are all dominated regarding new business formation, by the cities they contain. Firstly the distribution is lower indicating a spread of locations with a high density of new business formation, and secondly, it is shifted to the right indicating a higher number of businesses relative to the rest of England in more and different locations.
We would appear to be looking at a clear case of ‘first city bias’ as the political economists would describe it. This is where a countries first city receives a disproportionate share of public investment alongside more and better incentives for private investment compared to the second city. Certainly, the size and economic significance of Birmingham would support the idea that the UK suffers from this effect. Indeed, even if the population of the West Midlands conurbation rather than just that of Birmingham, is taken for comparison purposes. With a population of 2,440,986, the city is still less than half the size it should be if Zipf’s law applied. This law famously predicts that the population of the second city should be half that of the first city and it seems to apply in many comparable countries. In the 2010 census, New York had a population of 8,175,133. Los Angeles, ranked number 2, had a population of 3,792,621.
In short companies in the UK are being set up in the main close to centres of high population density. London predominates, probably to the point of drawing people and economic activity away from the West Midlands conurbation at least, if not most of the country to some extent. By these data, however, it is unlikely that a Northern powerhouse will emerge shortly. The disparity that is already all too apparent is, by this very recent data – only likely to continue if not increase.