We lay out the spec for our Business Data Dashboard, which maps business rates, company formations and closures and VAT registrations onto a city’s geography, alongside other economic data such as rates of self-employment.
We engaged with the economic development office of a Midlands city to look at the way they were driving business development. One of the problems they articulated was the disjointed data that they had to work with. Because of a tight budget, they were trying to use the Companies House data on company formation supplemented by snapshots provided at intervals by the ONS. These data were very hard to integrate, labour intensive to acquire and clean and ultimately lacked sufficient detail to help with specific projects. At the same time, they recognised that the Non-domestic rates data should be utilised given developments in government policy and their agenda for enhancing income. Nevertheless integrating these resources seemed technically impossible and consequently, data was the poor relation to their work – not available in sufficient geographical detail, on time or in a form that could easily be interrogated.
A further problem they identified was the importance of small businesses, many of which are not registered with companies house but they are very significant in the local economy. For a variety of reasons, they are hard to find and difficult to communicate with. Self-employment in the UK is at its highest level since records began almost 40 years ago, according to the Office for National Statistics. There are 4.6 million people working for themselves, with the proportion of the total workforce self-employed at 15% compared with 13% in 2008, and 8.7% in 1975. Of the 1.1 million increase in the total number of workers in the UK between the first quarter of 2008 and the second quarter of 2014, 732,000, or just over two-thirds, were self-employed. These jobs and businesses are often invisible to municipal authorities but can, when they are VAT registered and actively seeking business via the internet, be identified and located using advanced data acquisition technologies. That is what we offer.
We set out to create a group of services driven by big data and analytics that could provide an evidence base for decisions concerning economic development and forecasting around the business growth and development activity in a City or region. Our toolkit provides economic activity data concerning the Non-domestic (Business) Rates portfolio, companies births, deaths and business activities into an Interactive dashboard.
This tool combines data from a large variety of sources including Companies house and our Data Warehouse to project onto the map of the city’s properties, their value and function, new companies forming at Companies House or registering with HMRC for VAT and existing companies becoming dormant, ceasing to trade or deregistering. This is highly dynamic data which, when organised by industrial activity and located upon the map of the city, will provide decision and policy makers with an important tool. It allows the City to evaluate any current areas based on need or opportunity as well as ongoing projects to increase or enhance employment and rates revenue by helping new businesses set-up, relocate or grow. Because the city will know in great detail how many businesses were established, where and when as well as how they prosper, move or die. In effect, they will have a dashboard of their enterprise portfolio – a key tool.
A good example of the utility of the dashboard came to light when we set out to explore a key economic area containing large business parks and significant new inward investment. Our tool allowed us to draw a box around the relevant area on the map and instantly create a list of the companies located in the area. When we expanded the catchment area only slightly to incorporate a mixed area with domestic and retail properties, we found a large number of small businesses that had not been ‘visible’ as part of the economic activity of this part of the city. Demonstrating the benefit of being able to quickly and easily explore the city in a way that had hitherto been impossible.
A unique feature is the ability to provide an additional feed of non-domestic Rates data and incorporate it into the overall picture. For the first time we believe, it is possible to reconcile, in many cases, trading companies with their business locations in a way that is useful for local government to begin to manage their business information environment in a connected way. This was the technical issue which engaged our resources the most when the project was first considered – perhaps we will blog about our solution at a later date.
In all cases, these data tools are complemented by the ability to make useful comparisons between a particular town and city and any chosen comparator sub-region. We envisage this tool being used to benchmark development activity and provide quantifiable performance measures. At the same time, cities will, over time be able to identify the changes in the location, type of business and the growth dynamic between and within the different categories of business.
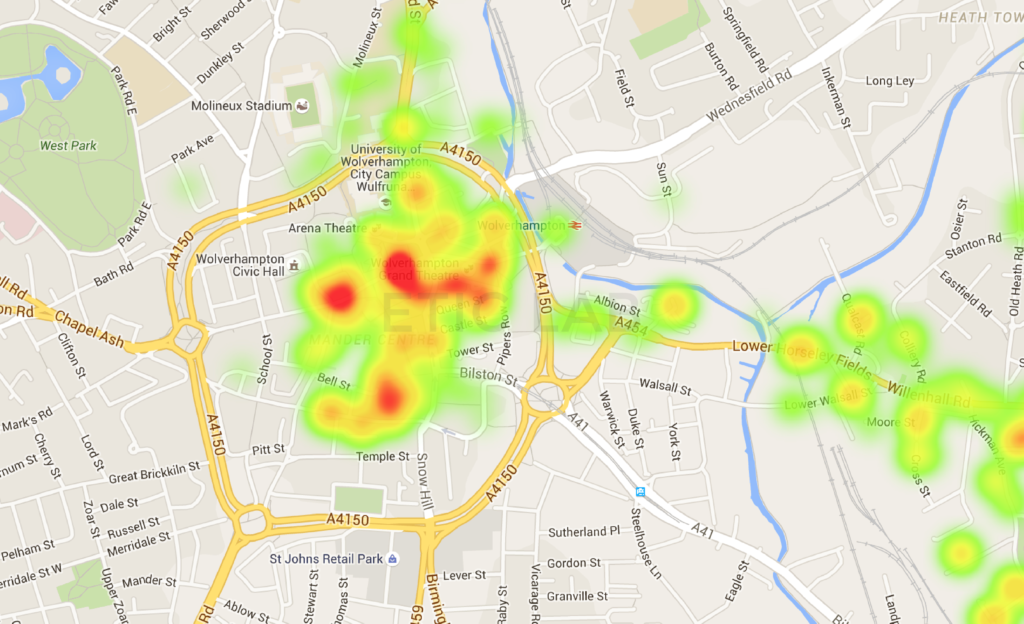
Sample Heat Map of small businesses in rateable properties within the city centre: